
Learn about call types, how to adjust the data interval, and how to see data within a specific date range.
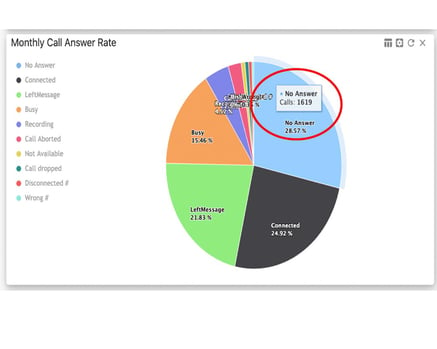
The Call Answer Rate widget keeps track of all phone calls made by AvantGuard to your accounts, and what happened during those phone calls. Phone call data is listed in the following ways:
- No Answer - Contact did not answer the phone.
- Connected - Contact answered the phone.
- Left Message - AG operator left a message on contact’s device.
- Busy - AG operator was unable to get through to contact.
- Recording - AG Operator reached a recording with no actionable steps.
- Call Aborted - The operator hung up due to procedure (this may happen when a person calls back while the operator is calling another contact).
- Not Available - Someone other than the contact answered the phone or the available contact was unavailable.
- Call Dropped - Call was disconnected due to a loss of signal.
- Disconnected # - The contact’s phone information is no longer in service.
- Wrong # - The contact’s phone number is not correct.
The call type information displayed in the graph is color coded and corresponds to the color dot next to the call type. When you hover over a segment of the graph, you’ll see a snapshot of the total number of calls that corresponds to that call type.
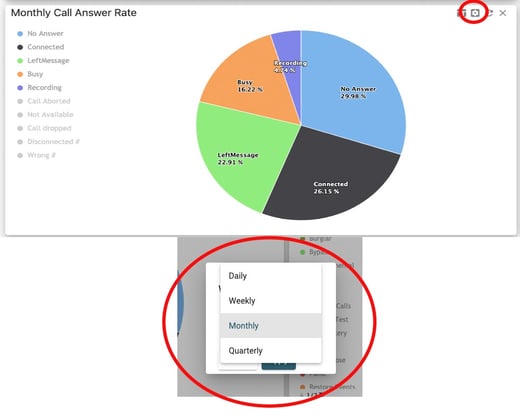
How To Change The Data Interval
You can adjust the interval in which the data is collected by clicking on the gears icon in the right corner of the widget.
This will open a dialogue box that allows you to change the interval in which the data is collected. You can select between the following options: daily, weekly, monthly, quarterly. After you select the interval, click apply.
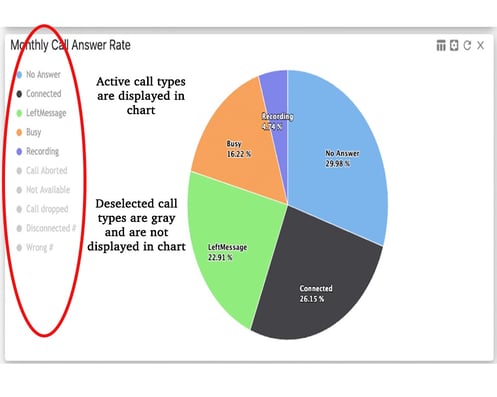
You can remove certain call types from the data by clicking on individual call types from the list just left of the chart.
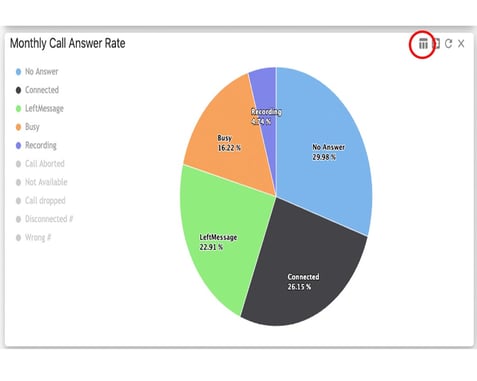
How To View Data Within a Specific Date Range
To view the call answer rate between a specific data range, click the detail icon just left of the gears icon.
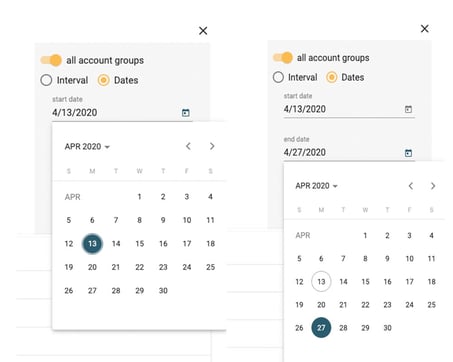
In the right corner of the detailed view window, click the dates button to select a specific date range.
You’ll see a start and end date appear. Click the calendar icon next to Start Date to select the beginning date of the range.
Then click the calendar icon next to End Date to select the last date of the range. Then click apply.
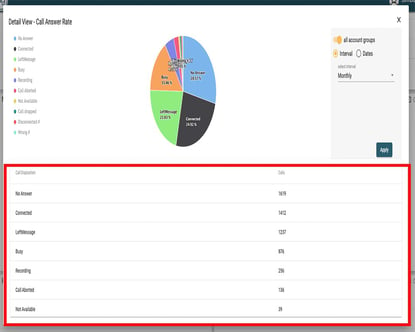
This will show you all of the call data between the specific date range.
In the menu below the chart, you will see all of the call types, and the total number of phone calls within the date or interval range.
Like in the dashboard view, you can add and remove call types by clicking the individual call types in the list left of the chart.
To exit the detailed view, click the X in the top right corner.