
Learn how to navigate the widget, add/remove accounts from your data set, and adjust the interval range.
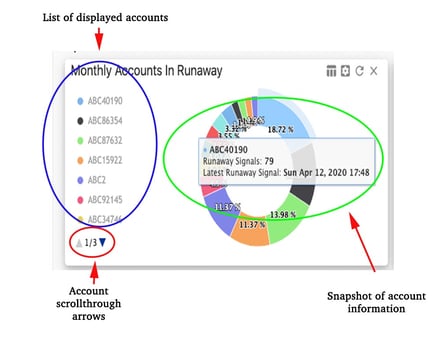
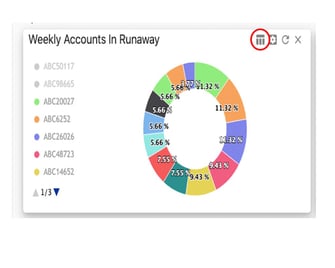
The Accounts In Runaway Widget displays the accounts with the most runaway signals (at least 15 of the same signal in less than one hour) sent to AvantGuard Monitoring Centers. You can adjust the number of runaway accounts displayed in the widget, as well as when the data is collected.
The accounts displayed in the graph are color coded and correspond to the color dot next to the list of account numbers. When you hover over a segment of the graph, you’ll see a snapshot of all the information corresponding to that segment.
You can click the arrows below the list of account numbers to scroll through all displayed account numbers.
Adding/Removing Accounts
To add an account to the Accounts In Runaway Widget, move your cursor to the gears icon and click.
A dialogue box will open with the widgets settings:
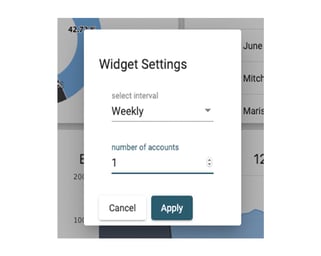
To add accounts to the data, simply click the up arrow by number of accounts. Then click apply.
To remove accounts from the data, click the down arrow by number of accounts. Then click apply.
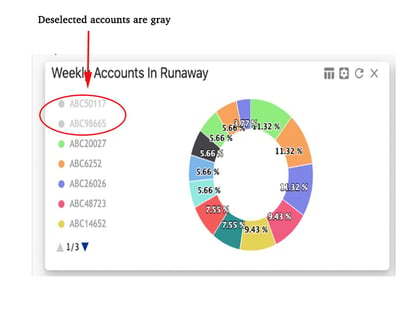
Once your accounts are added in settings, the top runaway accounts are displayed in the widget. You can continue to segment the data by adding/removing data from being displayed in the widget.
You can deselect accounts from being displayed by clicking on an account number from the list left of the chart. Deselected accounts will appear gray, and the corresponding account information is removed from the graph. To re-add information back into the graph, simply click a gray account number.
How To Adjust The Interval Range
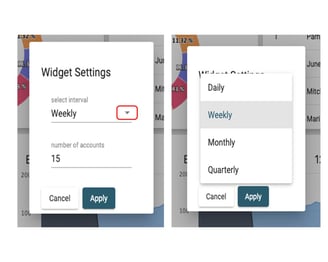
To adjust the interval at which the data is collected click on the gears icon to get to the settings menu.
The settings dialogue box will appear. Click the down arrow under Select Interval to change the interval. You have four interval options to choose from: daily, weekly, monthly or quarterly. Select the interval in which you want the data to be collected, and then press apply.
Detailed View
For a more detailed look at the data presented within the widget, click on the detailed view icon, just left of the gears icon.
In the detailed view, you get the same graph and account list as in the dashboard view, as well as a full list of each account, number of runaway signals and the latest signal date, below the graph.
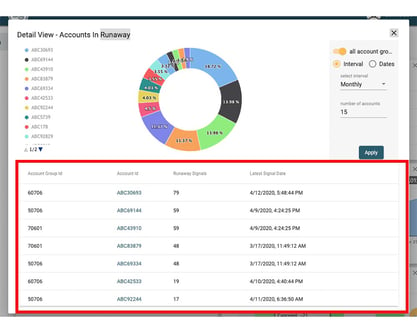
In the detailed view, you can change the interval at which the data is collected, as well as select specific data ranges to view runway accounts.
To view data within a specific data range click the dates button in the top right corner of the detailed view window. Next, click the calendar icon and select a Start Date. Then click the calendar icon next to End Date and select the end date. Select the number of accounts you would like to include then click apply.

This view will display all of the accounts with runaway signals within that specific date range.
To exit the detailed view, click the X in the top right corner of the detailed window.